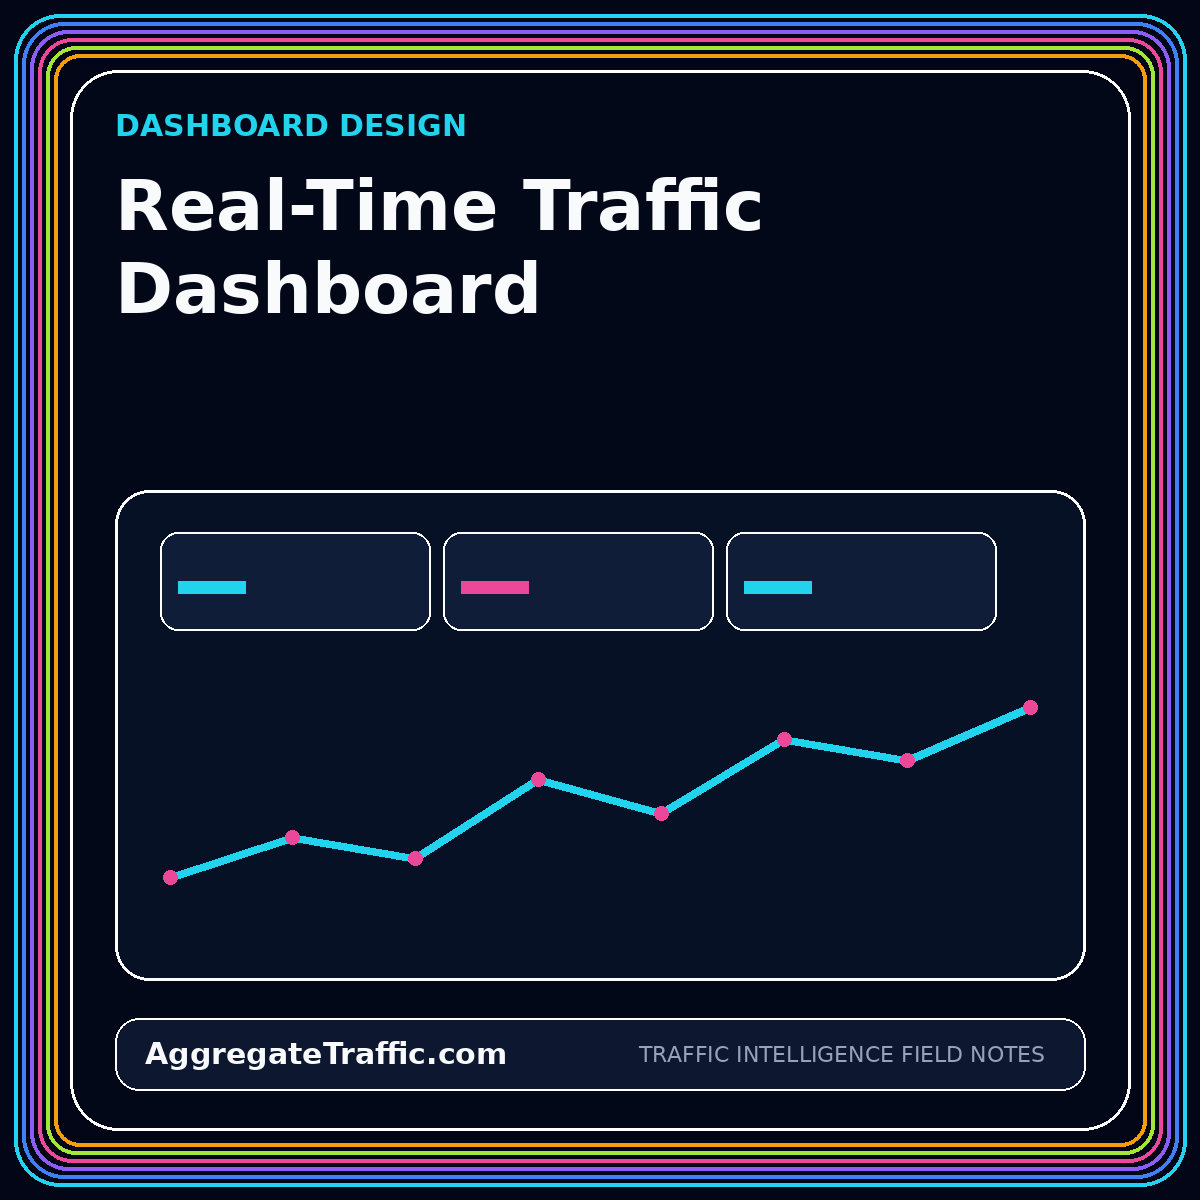
Real-time traffic dashboards are compelling because they make demand visible as it happens. They can help a launch team detect a broken campaign link, a newsroom see a sudden referral spike, an ecommerce team monitor a promotion, or an operations group confirm that a site is receiving expected traffic after a release. They can also create noise when every fluctuation is treated as an emergency and when rapidly updating numbers are presented without latency or quality context.
The design challenge is to connect refresh speed to an action window. A metric that updates every minute is useful only when someone can make a better decision within minutes. This guide explains how to choose real-time measures, combine them with baselines, expose data status, design anomaly signals, and separate operational monitoring from slower analytical reporting.
Define the action window before the refresh interval
Begin with the decision and its time horizon. A campaign launch may need five-minute checks for broken redirects, missing tags, or severe traffic gaps. A weekly content planning meeting does not. Write down who watches the dashboard, what conditions require action, which actions are available, and how quickly those actions can change the outcome. The refresh interval should follow from that workflow rather than from the fastest data feed available.
Operational implications
Classify each dashboard section as operational, diagnostic, or analytical. Operational tiles answer whether the system is functioning now. Diagnostic views help locate the source of a problem. Analytical views explain patterns over hours, days, or weeks. Mixing all three without hierarchy makes the interface difficult to scan. A viewer should be able to identify status in seconds and then drill into context without losing the original alert.
Choose measures that remain meaningful at short intervals
Counts such as active sessions, requests, key events, and error events can be useful in short windows, but rates need adequate denominators. A conversion rate based on three sessions is not a stable operating signal. Use minimum-volume thresholds and display the numerator and denominator together. For sparse outcomes, monitor leading indicators such as checkout starts or form views while keeping the final outcome in a longer-window panel.
Separate observed measures from modeled or attributed measures. Some attribution and identity processes require time to settle, so a real-time dashboard should not imply that channel credit is final. Label provisional fields and provide a link to the finalized daily view. The dashboard is more trustworthy when it explicitly distinguishes fast operational data from slower reconciled reporting.
- Now: activity and health signals that support immediate action.
- Today: cumulative progress against an expected range.
- Baseline: comparable periods adjusted for weekday and seasonality.
- Finalized: reconciled measures used for formal reporting.
Show data latency as a first-class status
Every panel should make its data-through time visible. A timestamp in the page footer is not enough when sources refresh at different rates. Place freshness next to the measure or group panels by latency class. Use states such as live, near-real-time, delayed, partial, and finalized. Define those states precisely so that a viewer knows whether a quiet chart reflects low demand or a stalled feed.
Latency can arise at several points: browser collection, network delivery, source processing, API availability, extraction, transformation, and dashboard caching. Instrument the pipeline so each delay can be measured. W3C Navigation Timing Level 2 illustrates how browser navigation timing can expose key moments in a page load. Similar time markers across the analytics pipeline help teams distinguish user behavior from measurement delay.
Pair current values with expected ranges
A current number without context forces the viewer to guess. Compare it with an expected range based on similar weekdays, hours, campaigns, or launch stages. Use a rolling median and an interval rather than a single average when traffic is volatile. For highly seasonal businesses, maintain separate baselines by market, product, or event type. The goal is not to predict perfectly; it is to show whether the current value is ordinary enough to ignore or unusual enough to inspect.
Avoid a universal red-yellow-green threshold. A twenty percent decline may be critical for a stable paid campaign and normal for a social referral spike. Define thresholds per metric and segment, and include both relative and absolute change. A small segment can move by one hundred percent with only a few visits. Display volume alongside percentage change to prevent false urgency.
Design anomaly signals for investigation, not theater
An anomaly indicator should answer three questions: what changed, compared with what, and what should the viewer inspect next? A useful alert might say that paid landing-page sessions are forty percent below the expected range for the last fifteen minutes, while ad clicks remain normal. That pattern points toward tracking, redirect, or site availability issues rather than campaign delivery. The alert should link directly to the relevant breakdown.
Suppress repeated alerts while an incident is acknowledged, and group related signals into one event. A missing analytics feed can cause every downstream metric to fall at once; the dashboard should identify the upstream failure rather than emit dozens of separate business alerts. Record when the anomaly began, who acknowledged it, what changed, and when the data recovered. The history becomes useful for tuning thresholds and improving runbooks.
- Signal: the metric and segment outside its expected range.
- Evidence: comparison window, volume, and freshness status.
- Likely causes: measurement, delivery, site, or genuine demand change.
- Next view: a focused breakdown that supports diagnosis.
Keep the visual hierarchy calm and scannable
Reserve saturated color for status and exceptions. If every chart uses neon gradients and animated counters, the viewer cannot distinguish important change from decoration. Use a restrained base palette, consistent scales, and stable positions for core metrics. A dashboard viewed during an incident should feel calmer than the incident, not more dramatic.
Place the highest-priority health and outcome indicators in the first viewport. Use small multiples for channel or geography comparisons so axes remain consistent. Avoid auto-rotating panels, dense legends, and unexplained composite scores. Tooltips can provide detail, but critical definitions and freshness should remain visible without hovering. Mobile layouts should preserve status and actions rather than simply stacking every desktop chart.
Connect monitoring to an operating process
A dashboard does not create accountability by itself. Define a monitoring owner, coverage hours, escalation path, and response playbook. Some dashboards are watched continuously during a launch; others are checked at scheduled points. Document which alerts can be ignored, which require validation, and which justify pausing spend or rolling back a release. The operating process should be tested before a high-stakes event.
Review false positives and missed incidents after each use. Adjust baselines, thresholds, and segmentation based on evidence. Remove panels that do not lead to decisions. Add annotations for releases, campaign changes, outages, and known source delays so later viewers can interpret the timeline. Continuous curation keeps the dashboard aligned with the actual operating environment.
Separate the live view from the performance record
Real-time data is excellent for detection but often unsuitable for final evaluation. Keep a finalized daily or weekly reporting layer that incorporates late events, attribution updates, cost reconciliation, and mapping corrections. The live view should link to that layer and explain when measures become final. This prevents screenshots of provisional values from becoming permanent business records.
The strongest dashboard system uses multiple tempos: a live health view, a daily decision view, and a periodic strategic view. Each tempo answers different questions with appropriate data maturity. Trying to make one dashboard serve every tempo usually produces a cluttered interface and conflicting expectations. Deliberate separation gives each audience the speed and certainty it actually needs.
Conclusion
A real-time traffic dashboard is successful when it shortens the path from a meaningful signal to an appropriate action. Fast refresh is only one component. Baselines, freshness, quality status, diagnostic paths, and operating ownership determine whether the dashboard is useful under pressure.
Design around the action window, label provisional measures, compare current activity with a relevant expectation, and reserve alerts for conditions that someone can investigate. The traffic dashboard design guide summarizes the hierarchy and operating controls.