Identify the audience and decision cadence
An executive, campaign operator, content editor, analytics engineer, and product manager need different detail. Document who uses the dashboard, which decisions it supports, how often those decisions occur, and what action is possible. A real-time view should exist only when a real-time action exists.
Separate live operational monitoring, daily decision reporting, and periodic strategic review. Live views emphasize health and anomalies. Daily views emphasize channel, content, and funnel performance after data settles. Strategic views emphasize trend, efficiency, cohort, and outcome relationships.
Create a clear information hierarchy
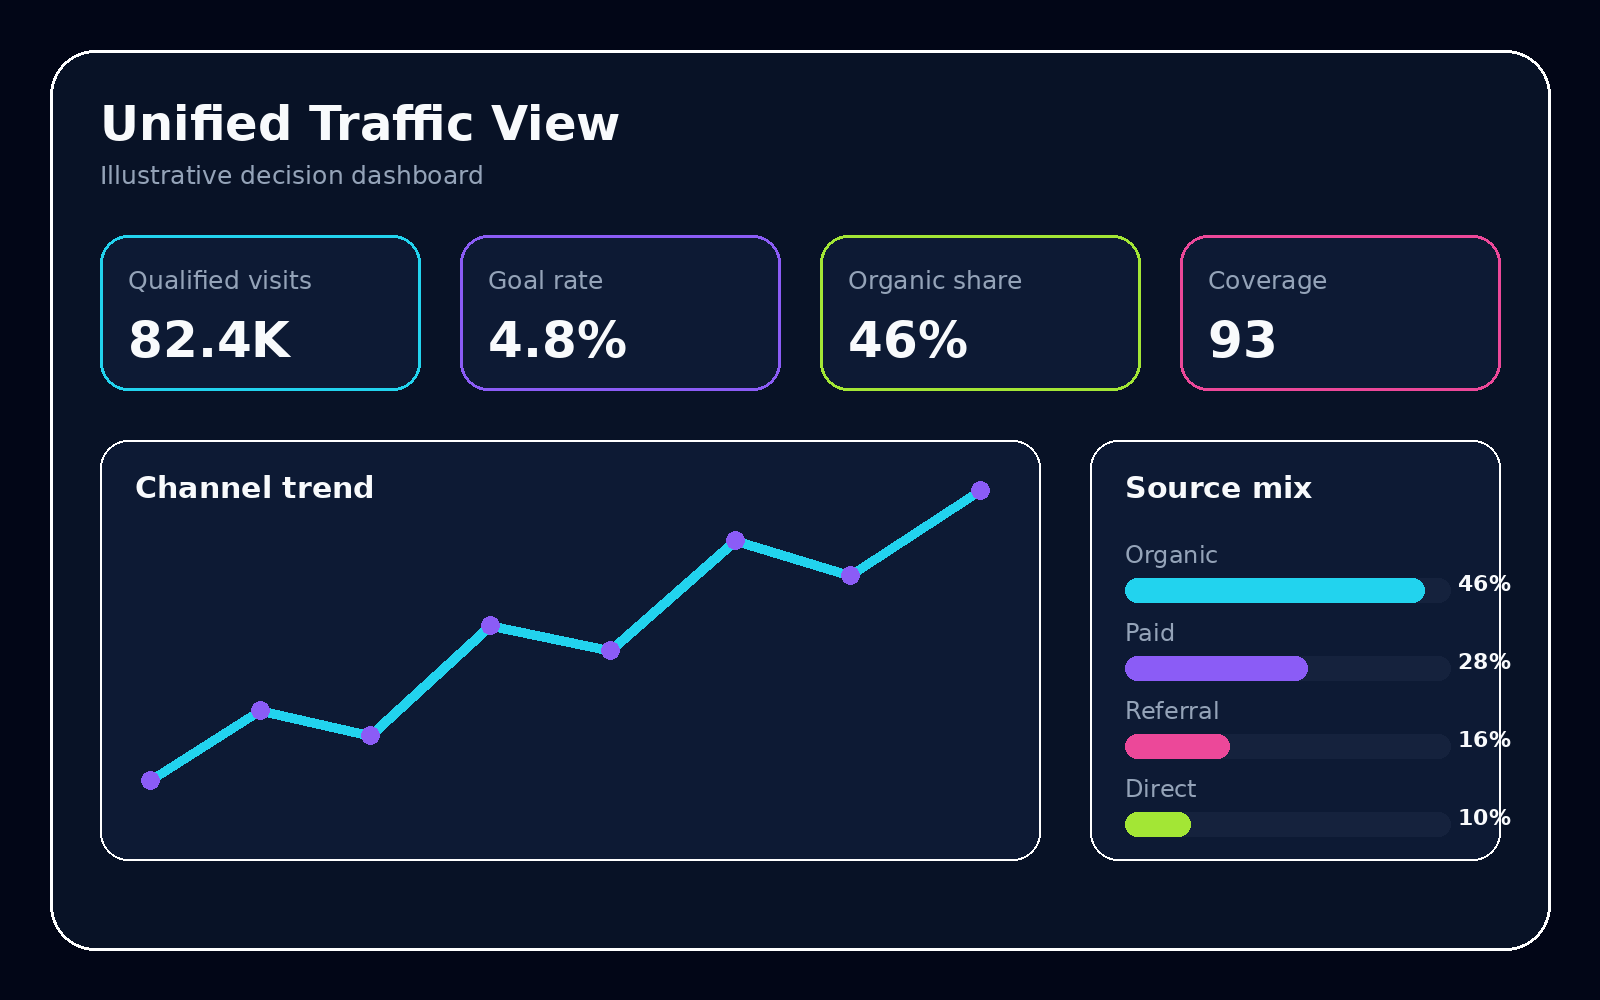
The first viewport should contain the primary outcome, leading indicators, comparison, and data status. Secondary sections can explain acquisition mix, landing-page performance, funnels, and cohorts. Diagnostic detail belongs behind a drill path rather than competing with the headline.
- Outcome: the user or business result the team is trying to improve.
- Drivers: measures expected to influence the outcome.
- Guardrails: quality, cost, or experience measures that should not deteriorate.
- Status: freshness, coverage, definition version, and known incidents.
Use comparisons that match the context
Show current performance against an appropriate reference: same weekday, comparable campaign stage, expected range, matched cohort, target band, or experiment control. A previous-period percentage without context can create urgency around ordinary seasonality.
Display volume with rates. Small denominators can produce extreme percentages. For volatile traffic, use medians and intervals instead of one average. Annotate releases, media changes, migrations, outages, and source delays.
Make alerts explainable
An alert should identify the metric, segment, expected range, observed value, freshness state, and next diagnostic view. Group downstream symptoms under an upstream data failure. Suppress repeated alerts while an incident is acknowledged and preserve an event history for threshold review.
Use restrained visual design
Reserve high-saturation color for status and exceptions. Keep scales consistent across small multiples, avoid decorative motion, and label important definitions without requiring hover. Dense legends and rotating panels slow diagnosis. Mobile layouts should preserve status, action, and the highest-priority breakdown.
Composite scores should expose their components, weights, and interpretation. When a direct measure is available, prefer it. A calm dashboard supports judgment under pressure.
Operate the dashboard as a product
Assign owners for definitions, data quality, interface changes, and response workflows. Review unused panels, false alerts, missing diagnostics, and repeated stakeholder questions. Maintain release notes when metrics or mappings change.
Link the live interface to finalized reporting so provisional values do not become the permanent record. A mature dashboard system has multiple tempos and one semantic foundation.