Choose the comparison unit from the decision
A whole-site average is rarely the right benchmark for a landing page, campaign, or market. Define the unit using journey stage, page type, channel, device, geography, audience, product, and objective. Keep the cohort broad enough to have volume and narrow enough to be relevant.
Store the metric definition, filters, timezone, currency, consent coverage, and version with the series. A current value and benchmark calculated under different rules should not appear in the same performance gap.
Build internal baselines with seasonality
Compare current performance with similar weekdays, hours, campaign stages, or seasonal periods. Rolling medians and percentile bands are often more robust than a single average. Annotate outages, releases, promotions, and source delays so they do not become unexplained baseline behavior.
Reset a baseline only through a documented process after a lasting product, market, or measurement change. Preserve the historical reference and mark the break.
Use matched cohorts and minimum volume
Compare paid campaigns with similar intent, content pages with similar age and topic, referral sources with similar placement, and markets with similar availability. A benchmark can be directionally wrong when audience mix explains the observed difference.
Define a minimum sample size or exposure threshold. Suppress league-table rankings for sparse cohorts and show wider ranges when uncertainty is high. Report absolute impact alongside relative change.
Separate benchmarks, targets, and forecasts
| Reference | Question | Typical basis |
|---|---|---|
| Benchmark | How does this compare with a relevant observed reference? | History, cohort, experiment, or qualified external data. |
| Target | What level are we trying to achieve? | Strategy, investment, capacity, and desired outcome. |
| Forecast | What do we expect under stated assumptions? | Trend, seasonality, planned activity, and constraints. |
Use target bands rather than false precision when assumptions are uncertain. Keep revisions visible and explain which assumption changed.
Qualify external comparisons
Review the source population, time period, market, business model, channel mix, metric denominator, weighting, and collection method. If methodology is unavailable, label the figure directional. Do not tie major budget or compensation decisions to opaque averages.
External data is most useful for framing a question or identifying a plausible range. Internal cohorts and controlled experiments usually provide stronger evidence for an operational change.
Design the benchmark review cycle
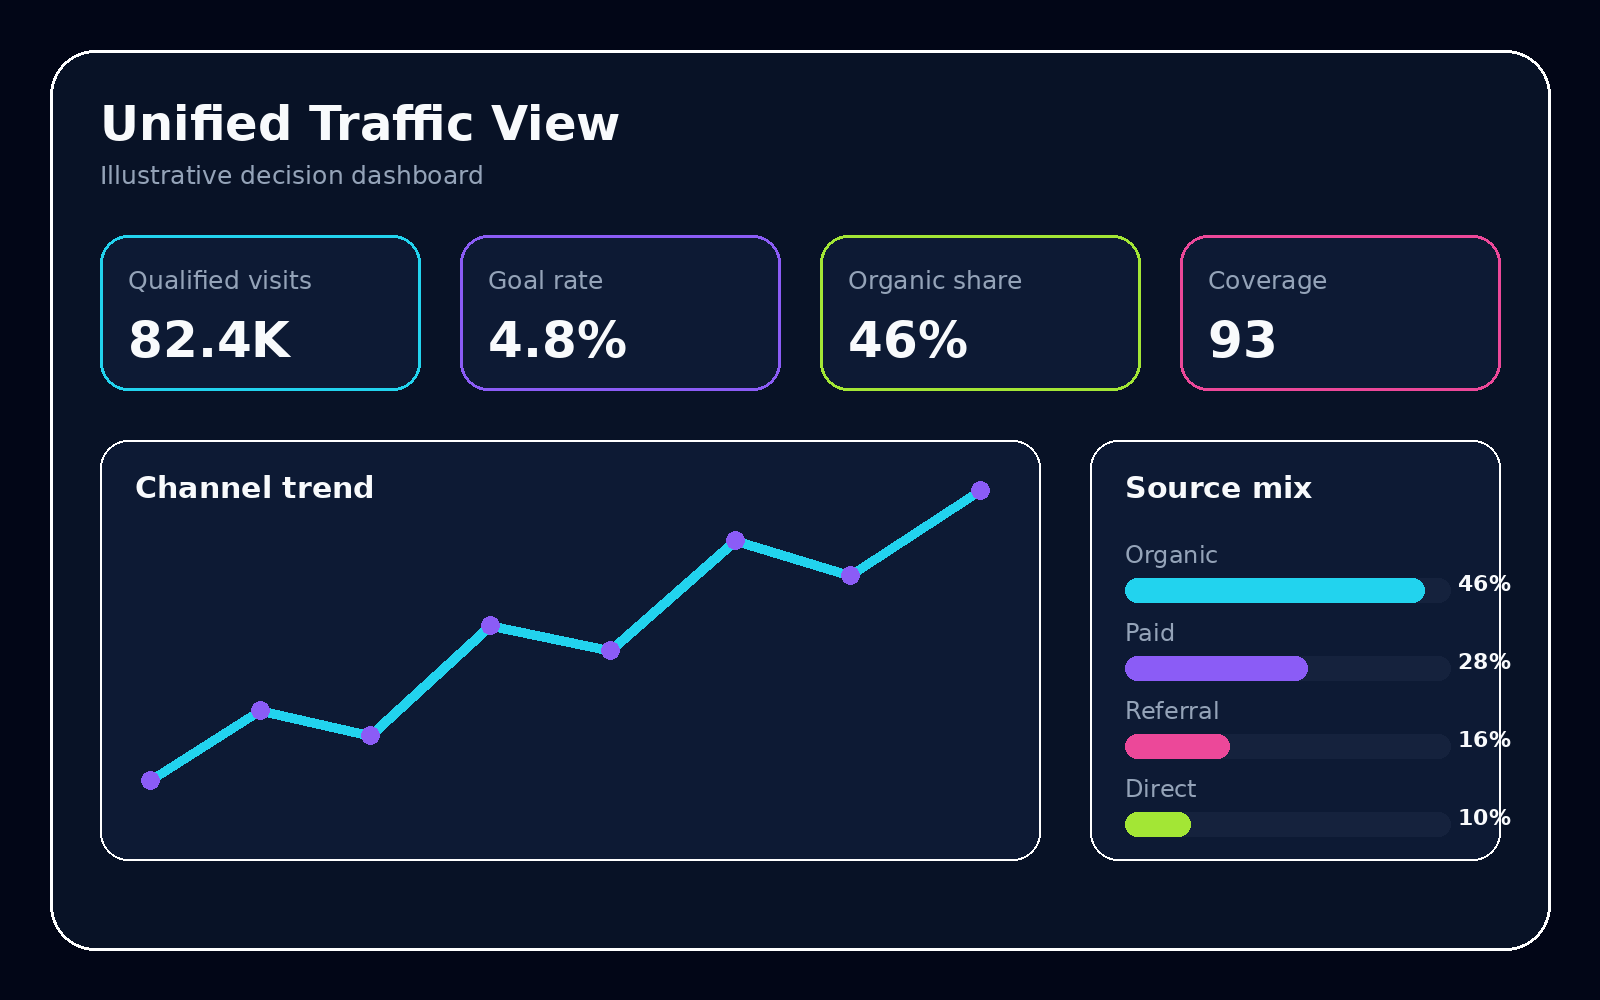
Show current value, range, volume, cohort, definition, and annotations in one view. Provide a drill-down to the pages, campaigns, or segments that contribute most to the gap. Assign an owner and follow-up action when the gap persists.
Retire references when the product, population, or measurement system changes enough that comparison is no longer fair. Benchmark governance keeps the scorecard from quietly comparing different realities.